
How to Use Participation by Subpopulation
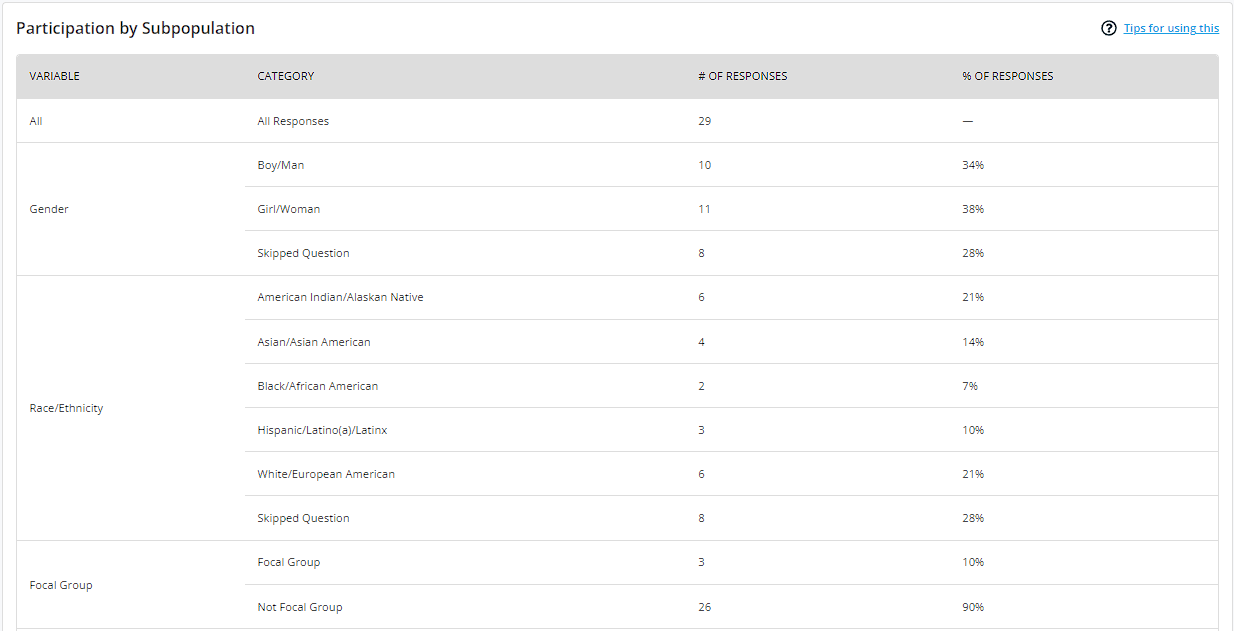
Learn respondent demographics. The "# of Responses" column is the number of survey responses in which the respondent identified with the group listed in the adjacent column. The “% of Responses” column is the percent of all responses associated with the group. It's important to note that individuals are counted multiple times if they respond in different Classes/Groups, resulting in duplicate counts for the respective group(s).
Responses are included as “Skipped Question” if the respondent skipped a demographic question or selected “prefer not to answer” to a demographic question.
Check your responses’ representativeness. Compare the table to what you know about respondents. For example, if 60% of your students are White/European American, but 90% of your responses are from White/European-American students, then you may be under-surveying other groups of students.
Related articles
- How do I know which participants completed the survey?
- How do I maximize student participation in Ascend & Elevate?
- What’s a good response rate?
- How do I obtain a more representative sample of survey respondents?
- How are survey results disaggregated?
- What does "basic needs security" mean in Ascend?
- What is a Focal Group and how do I set one up?
- In Focal Group counts, what does “in some classes/groups” mean?