
How to Use the Student Experience Overview
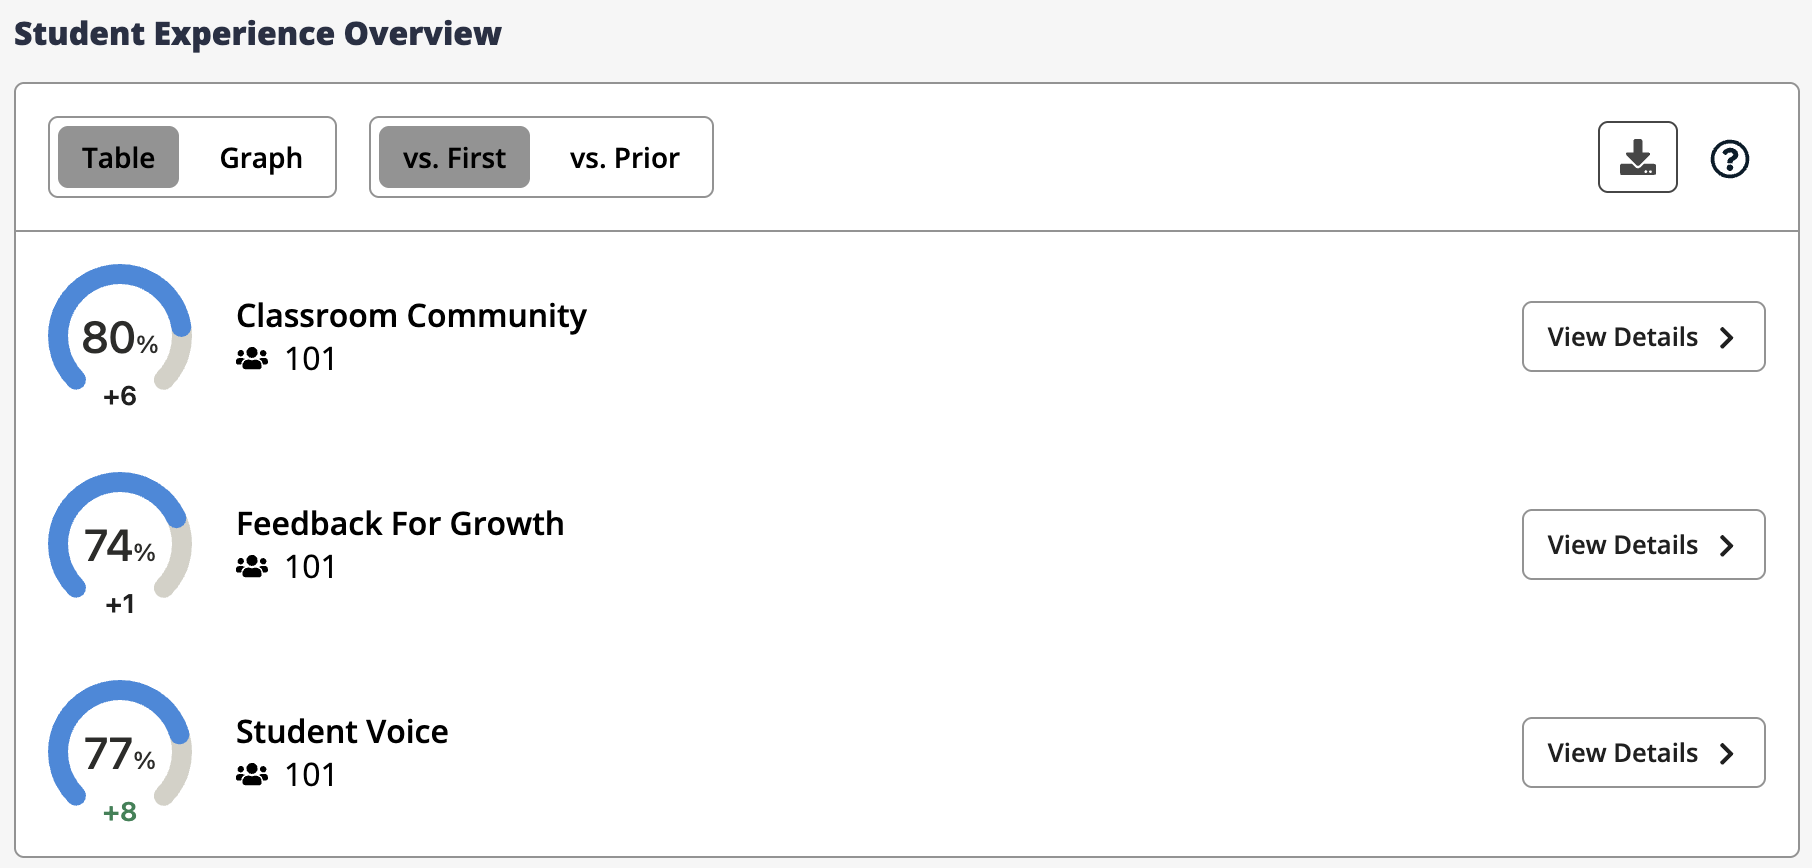
The Student Experience Overview provides a high-level summary of survey results for each learning condition and key information that can help you decide where to focus your attention. It includes:
- Results from the most recent survey.
- The number of responses recorded for at least one item in each condition.
- When the survey is completed more than once, it includes change from the first survey to the most recent and change from the prior survey to the most recent.
- The option to View Details (or detailed results) for each learning condition.
Below are a few tips for using the Student Experience Overview.
- Celebrate strengths and improvements. Your 1-2 highest numbers are strengths, and large improvements are highlighted in green. Celebrate them!
- Discover what your students need more of. The 1-2 lowest numbers show what your students need more of and represent opportunities to improve student experience.
- Look for trends over time. The line graph provides a visual summary to help you recognize trends over time across all learning conditions. Although improvement efforts may be focused on one or two learning conditions, we recommend reviewing the trends line graph to ensure all learning conditions trend toward improvement over time.
- Dig deeper. Click View Details for any learning condition to view results for each question, disaggregated results, change over time, the distribution of responses, and recommendations for improvement.
Related articles
- How to use detailed results by learning condition
- How are data calculated in reports?
- What does "rated positively" mean?
- How are responses to negatively worded questions displayed in reports?
- How are survey results disaggregated?
- How do I know which participants completed the survey?
- How do I see results for each survey?
- What do we do with missing data (when participants skip a survey)?